Preview
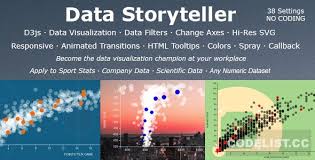
Data Storyteller Responsive SVG Bubble Chart Visualization
- Help users visualize and understand numeric data in an engaging and fun way
- Help users see patterns, relationships and outliers in the data
- Apply to any numeric dataset (company data, scientific data, sports data, etc.)
- Assign data columns in your CSV file to X and Y axes
- Crisp, high resolution SVG
- Responsive or fixed dimensions
- Quickly locate slices of data in the visualization using filters
- Filters are automatically created from the CSV data file
- Animated transitions – when the user changes the X or Y axis, the data bubbles animate/transition in the visualization
- Tooltips – there are default tooltips, but you can optionally create an HTML template that pulls in the underlying data
- Callbacks – optionally add your own code to take action when the user clicks a bubble or selects a filter (with full access to the data associated with those bubbles from the underlying CSV file)
- Create multiple data visualizations on the same HTML page
- 6 examples included. Modify/add configuration options … then copy/paste into your HTML page.
- Easy to use … no programming